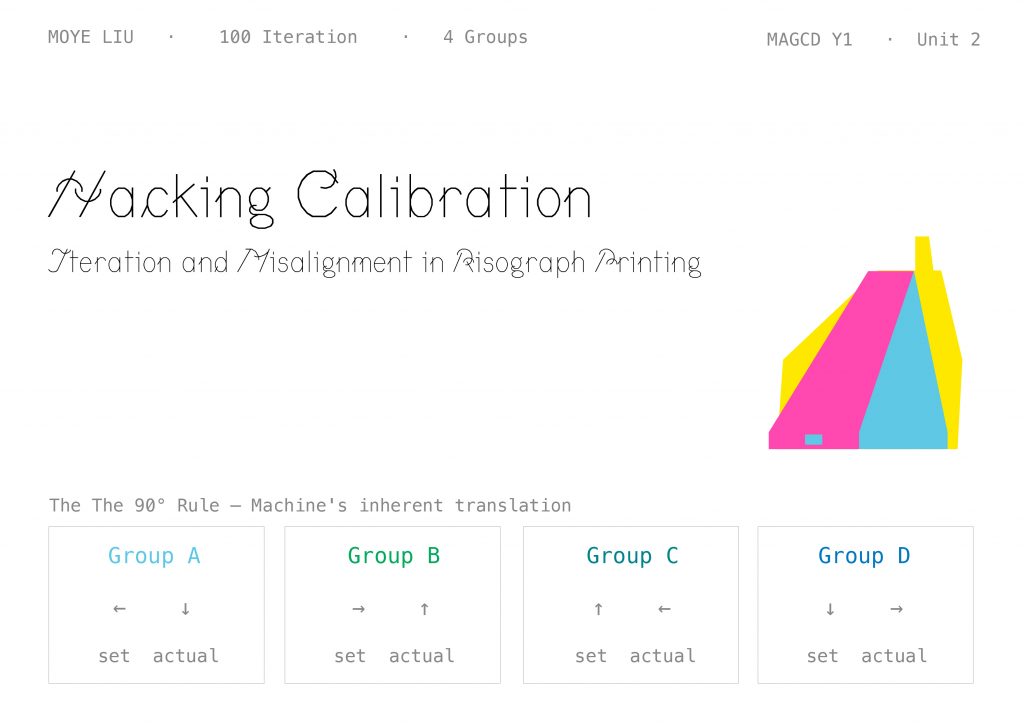
My Unit 2 project is called Hacking Calibration
— Iteration and Misalignment in Risograph Printing. It’s a 100-iteration printmaking project about machines, misalignment, and treating “error” as a subject. Over the next seven minutes I’ll take you through its starting point, the decisions behind it, the system it became, and the questions it’s opening up.
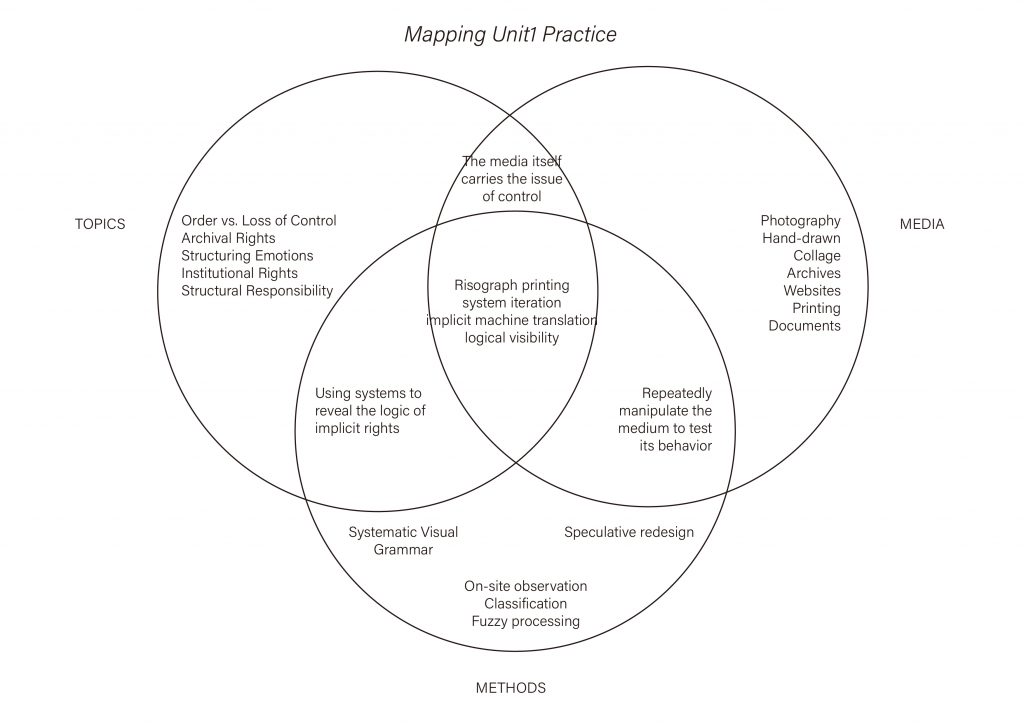
So look back to Unit 1. The topics I’ve been working with
Order vs Loss of Control, Archival Rights, Institutional Rights are all about one thing: how power gets quietly embedded into systems. Along the way I tried a lot of media: photography, hand-drawing, collage, archives, websites, print, documents. But the one medium where topic, media, and methods truly converge is Risograph printing. Because Riso itself carries a hidden logic
the medium itself is the question of control. It isn’t just a way of printing; it’s a whole system I have to move with before I can see it. That’s why I chose it as the vehicle for all of Unit 2.
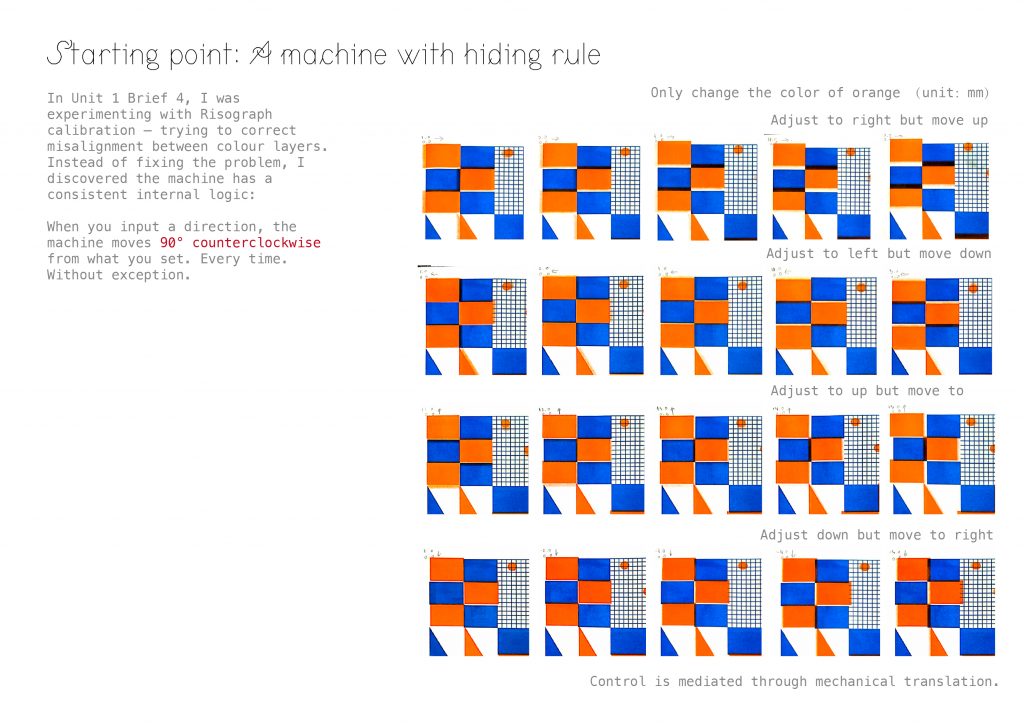
The real starting point was a “failure” from Unit 1 Brief 4. I was trying to calibrate the Riso — to line the colour layers up — and no matter what I did, they wouldn’t match. After many attempts I realised the machine wasn’t broken. It had its own rule: When you input a direction, it outputs that direction rotated 90° counterclockwise. Every time. Without exception. Tell it to go left, it goes down. Tell it to go right, it goes up. The moment I wrote that down, the misalignment stopped being an error — it became the machine’s own translation system. “Error” turned into “subject.” That’s the first real seed of Unit 2.
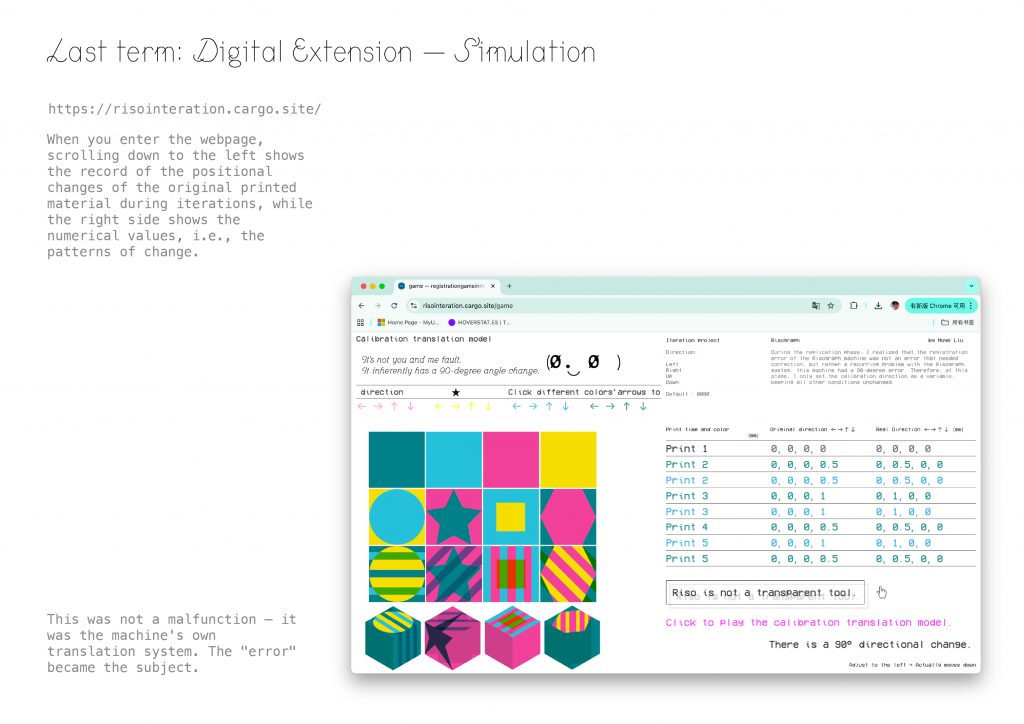
Last term I built this logic into a web simulation — risointeration.cargo.site. The left side shows the positional shift of each print across iterations; the right side shows the numerical values behind it. That’s where I first wrote down the line — Riso is not a transparent tool. It looks direct, but every step carries a layer of hidden translation. That sentence became the starting point for all of Unit 2.
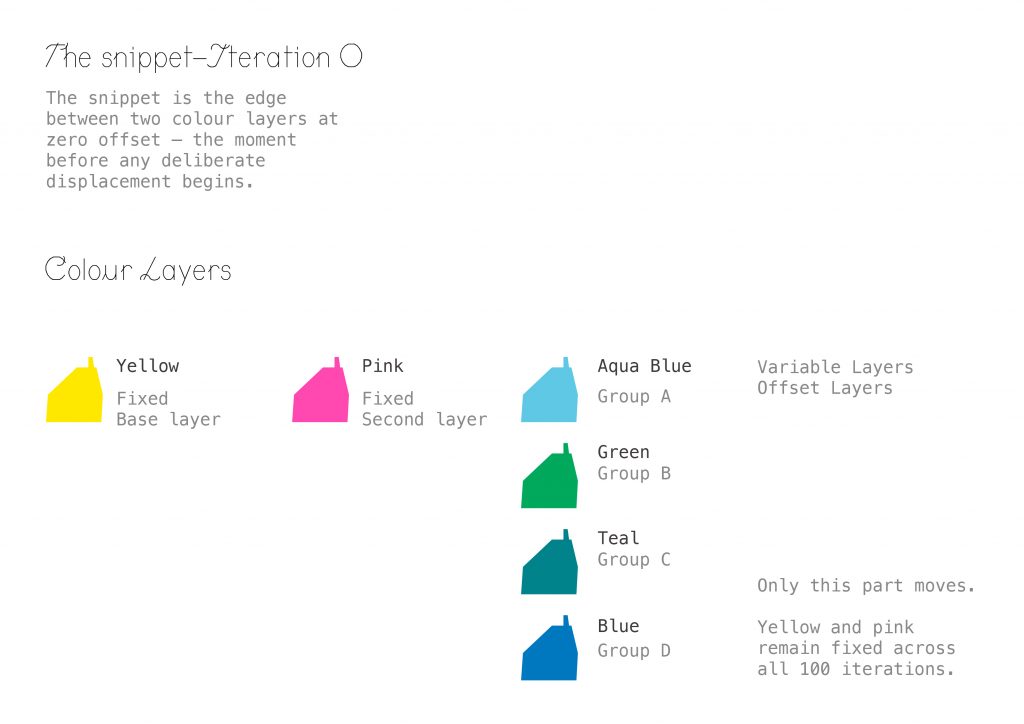
When Unit 2 began, the first thing I looked for was the smallest unit — the snippet. It’s the edge between two colour layers at zero offset — the moment just before any deliberate displacement begins. I set up a three-layer structure: Yellow as the fixed base; Pink as the fixed second layer; and a third layer that changes by group — Aqua Blue for Group A, Green for B, Teal for C, Blue for D. Across all 100 iterations, only the third layer moves. Yellow and Pink are my baseline.
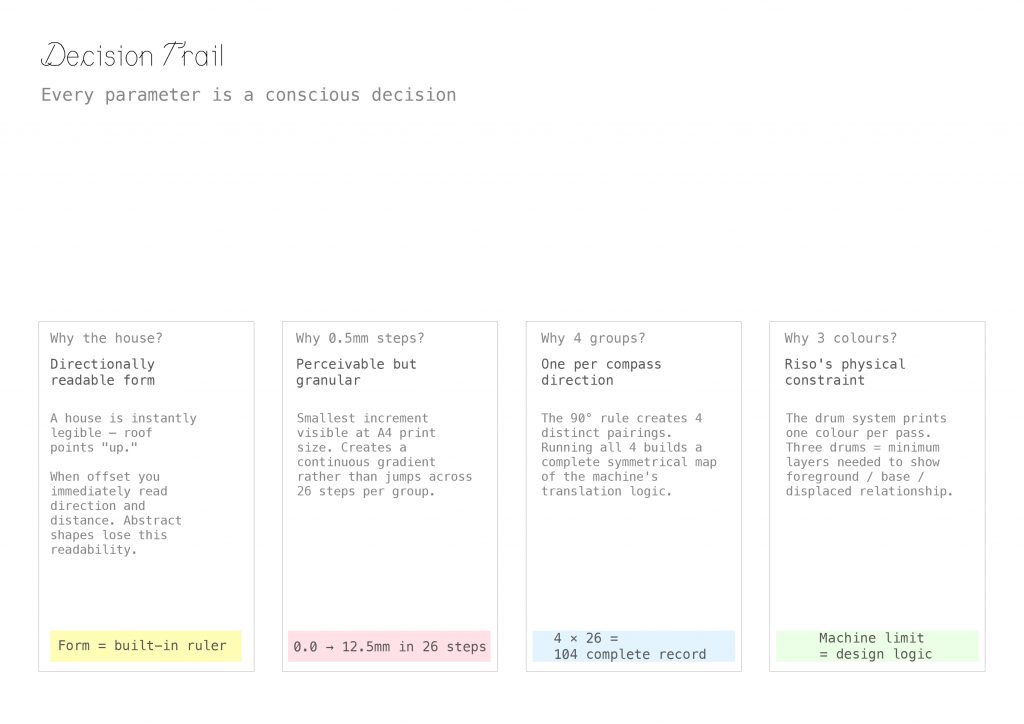
So those are my decision trail. Why 0.5 mm? It’s the smallest increment the eye can still perceive at A4 scale. Across 26 steps it reads as a continuous gradient instead of visible jumps. Why four groups? Because the 90° rule produces exactly four directional pairings. Running all four is a complete, symmetrical map of the machine’s translation logic. Why only three colours? Because of Riso’s physical limit — the drum system prints one colour per pass, and three drums is the minimum needed to show foreground, base, and displacement together. Machine limit = design logic. The machine’s constraint becomes the grammar of the design.
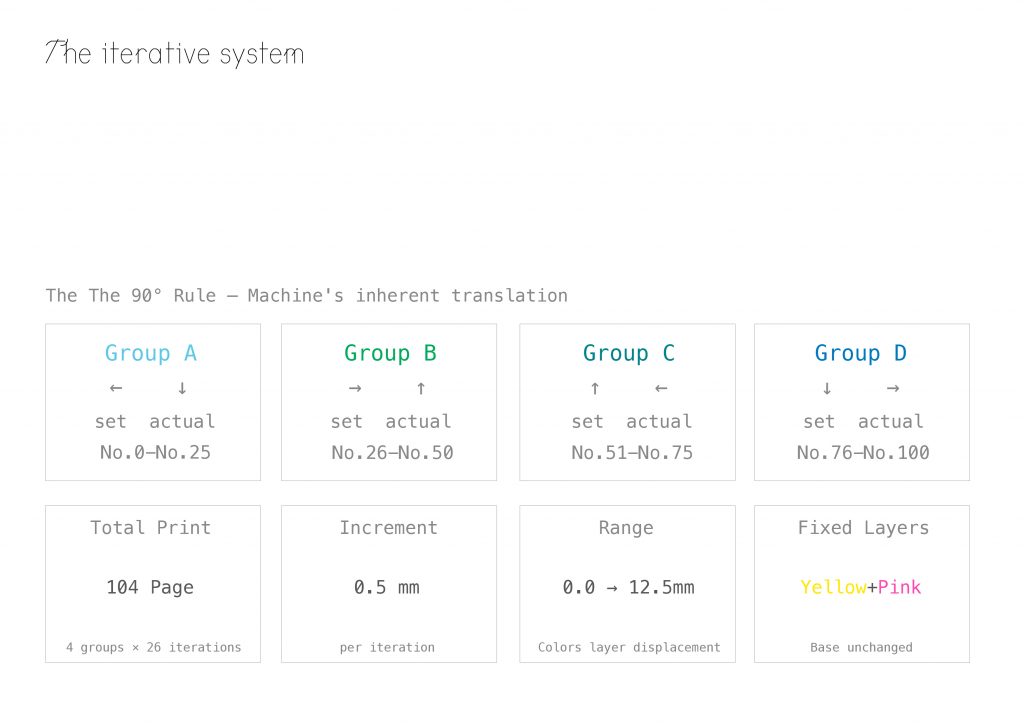
The system looks like this: Group A is set ← / actual ↓, numbered No.0–25; Group B is → / ↑, No.26–50; Group C is ↑ / ←, No.51–75; Group D is ↓ / →, No.76–100.
Plus four edition pages — 104 pages in total. Each step is 0.5 mm, ranging from 0.0 to 12.5 mm. Yellow and Pink stay completely fixed across all pages. The only variable is the third layer’s displacement.
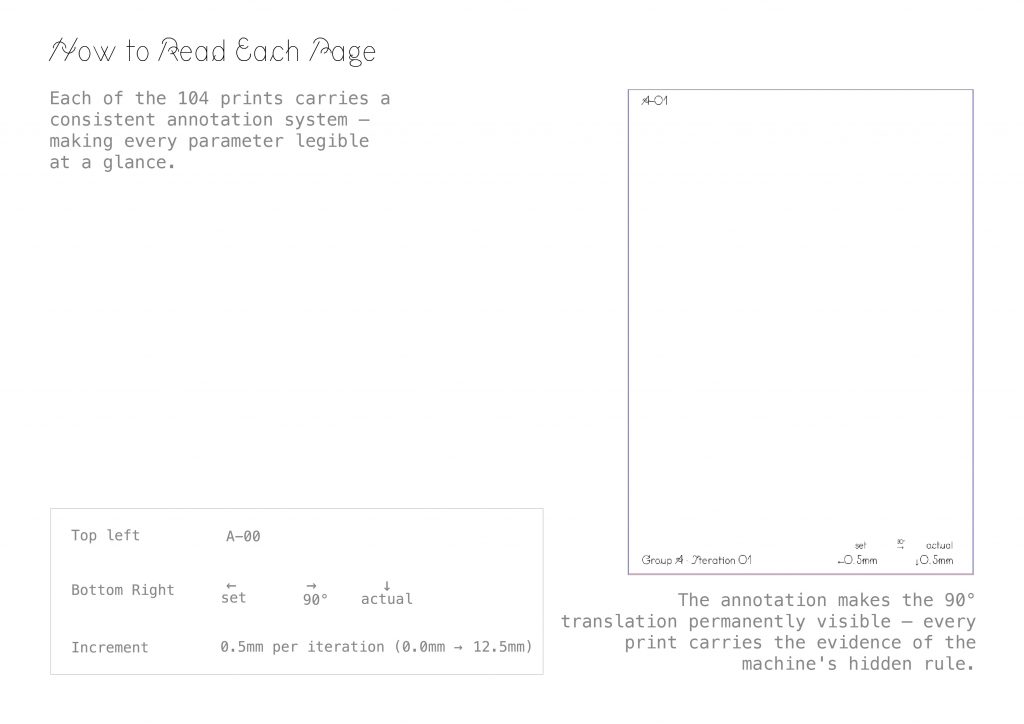
Every print carries the same annotation system. Top-left: the iteration ID, from A-00 to D-25. Bottom-right: three fields — set → 90° → actual — written out explicitly. Which means: even if you only hold a single print in your hand, you can reverse-engineer the entire rule. The annotation isn’t decoration — it keeps the machine’s hidden logic permanently visible.
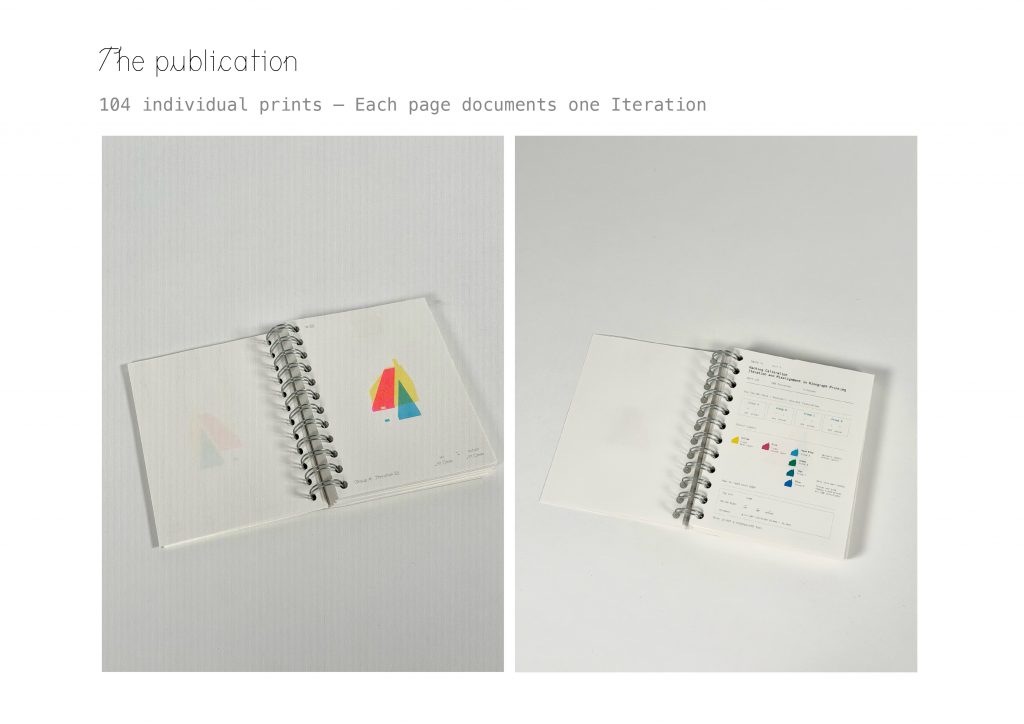
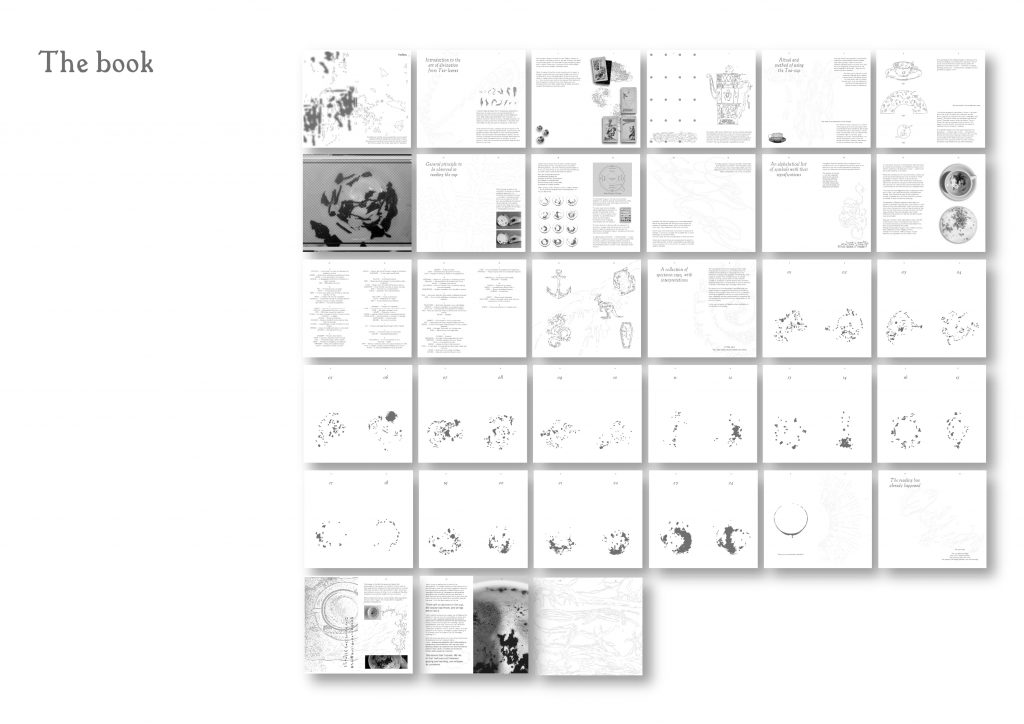
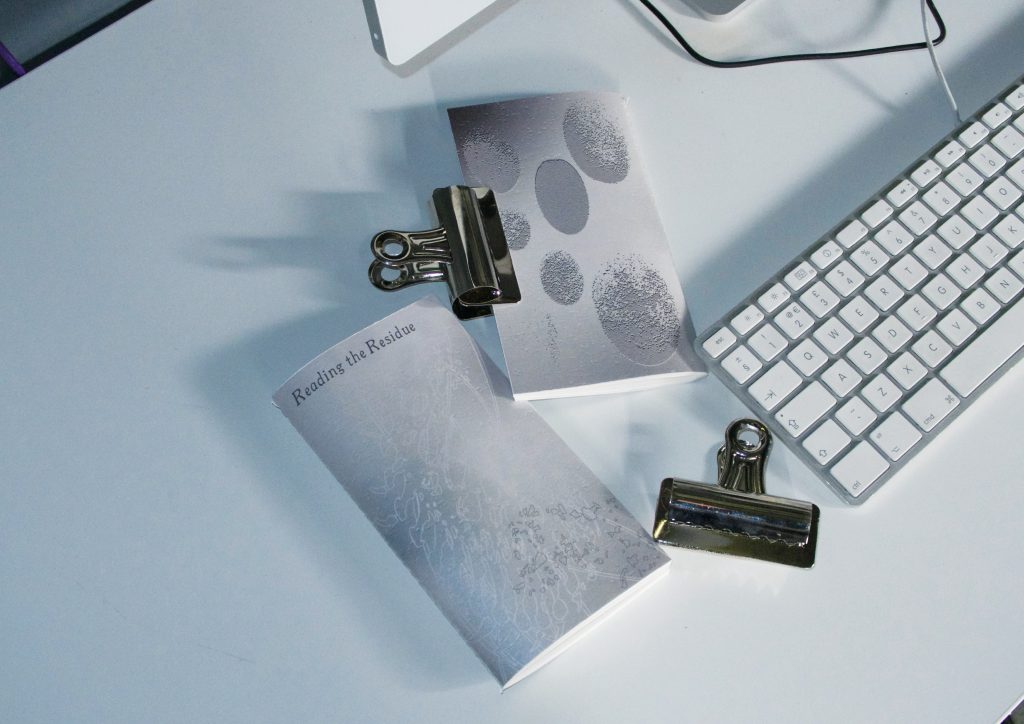
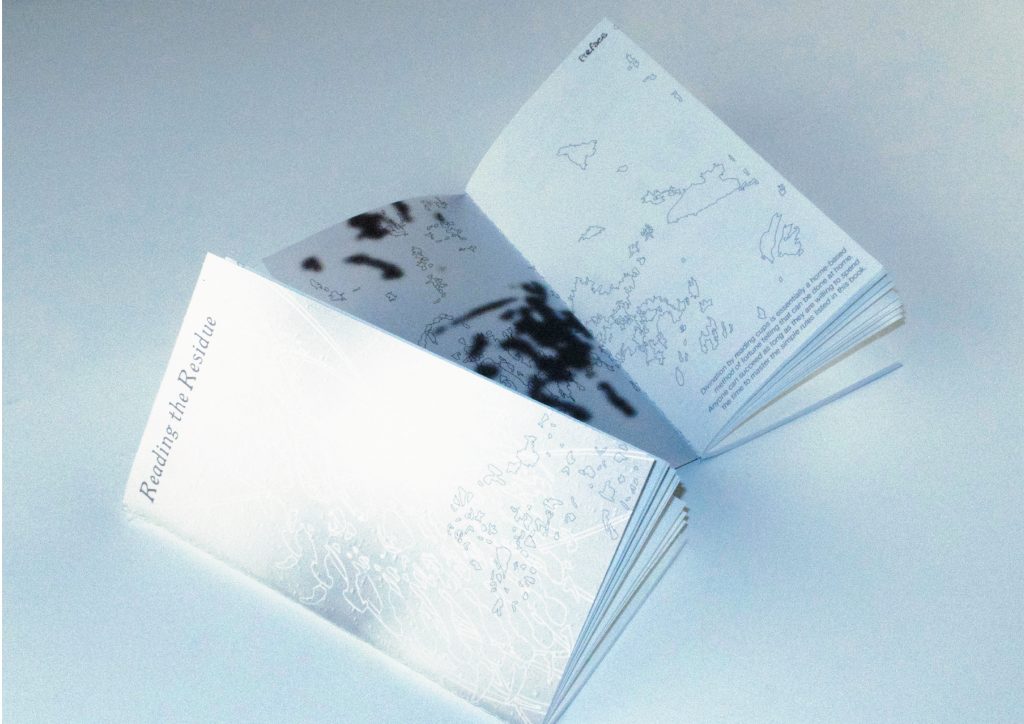
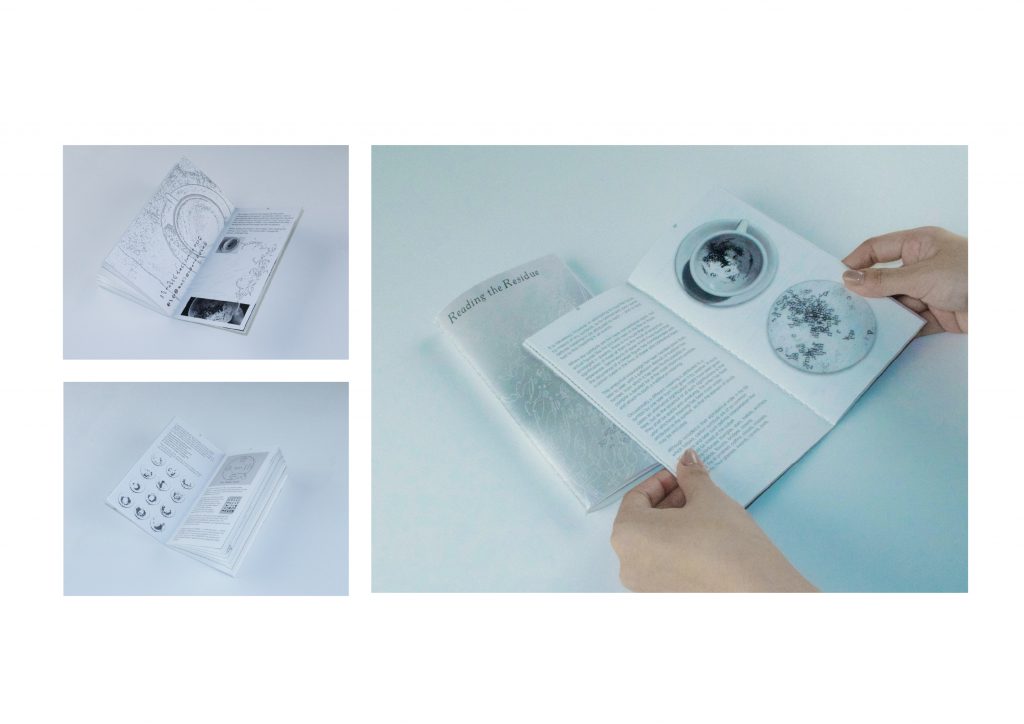
The final physical form is a 104-page spiral-bound publication. One iteration per page, so turning the pages is literally a replay of the machine’s translation. If you flip through the pages quickly, it’s like a comic book; you can clearly see the movement patterns.
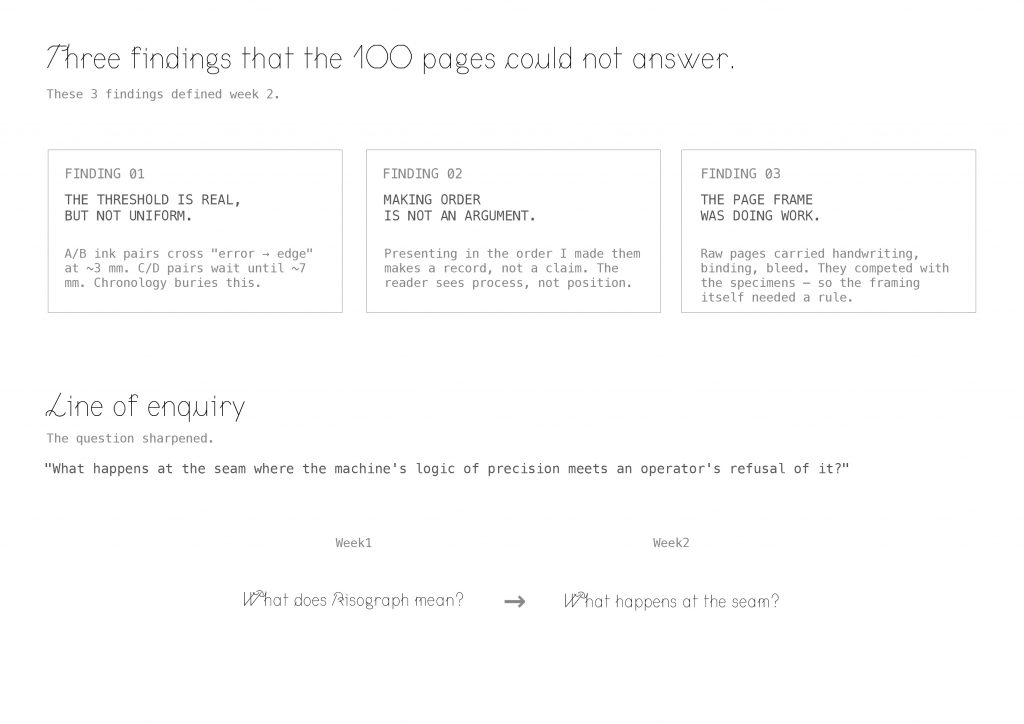
Those hundred pages couldn’t answer.
Three findings:
One — the threshold is real, but not uniform. A and B ink pairs cross from “error” to “edge” at around 3 millimetres. C and D pairs don’t cross until about 7. Chronology buries this.
Two — making order is not an argument. Presenting the iterations in the order I made them produces a record, not a claim. The reader sees process, not position.
Three — the page frame was doing work. Raw pages carried handwriting, binding, bleed — they competed with the specimens. So the framing itself needed a rule.
These three findings defined Week 2. They let me sharpen the question. Last week I was asking: what does Risograph mean? This week, I’m asking — what happens at the seam, where the machine’s logic of precision meets an operator’s refusal of it?
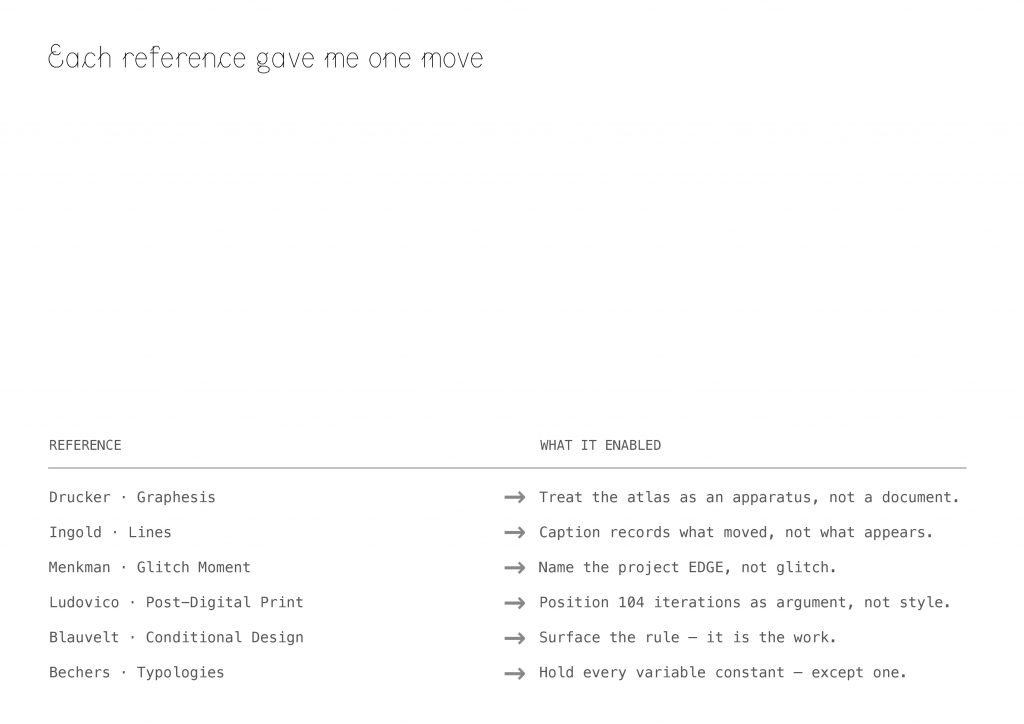
I find six reference this week, and each one turned into one concrete move.
Drucker’s Graphesis taught me that the atlas isn’t a document of my iterations — it’s an apparatus that produces misalignment as a subject.
Ingold’s Lines told me the caption should record what moved, not what appears.
Menkman’s Glitch Moment(um) framed the glitch as productive rupture — but I depart from her, because the Riso’s edge stays sharp. That’s why I named the project EDGE, not glitch.
Ludovico let me position the 104 iterations as an argument about print, not a stylistic exercise. The Conditional Design workbook pushed me to surface the rule — the rule is the work. And the Bechers gave me the deepest protocol of all: hold every variable constant, except one.
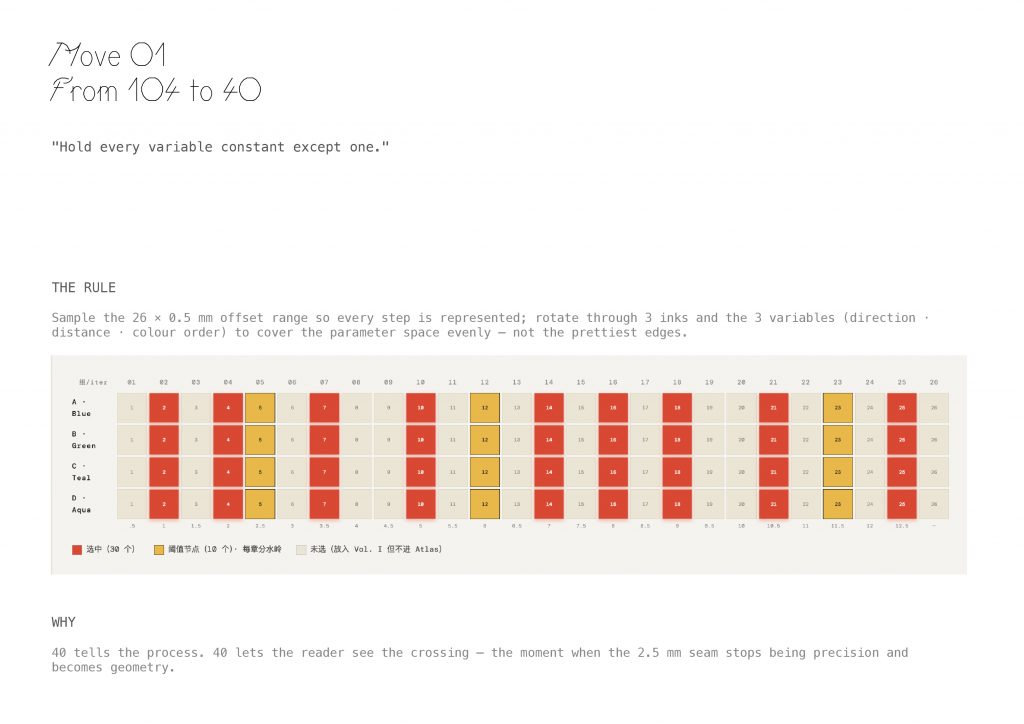
Move One: from 104 to 40.
The rule — I sampled the 26-step × 0.5 mm offset range so every step is represented. I rotated through 3 inks and 3 variables — direction, distance, colour order — to cover the parameter space evenly. Not the prettiest edges.
Why 40? 40 lets the reader see the crossing — the moment when the 2.5-millimetre seam stops being precision and becomes geometry.
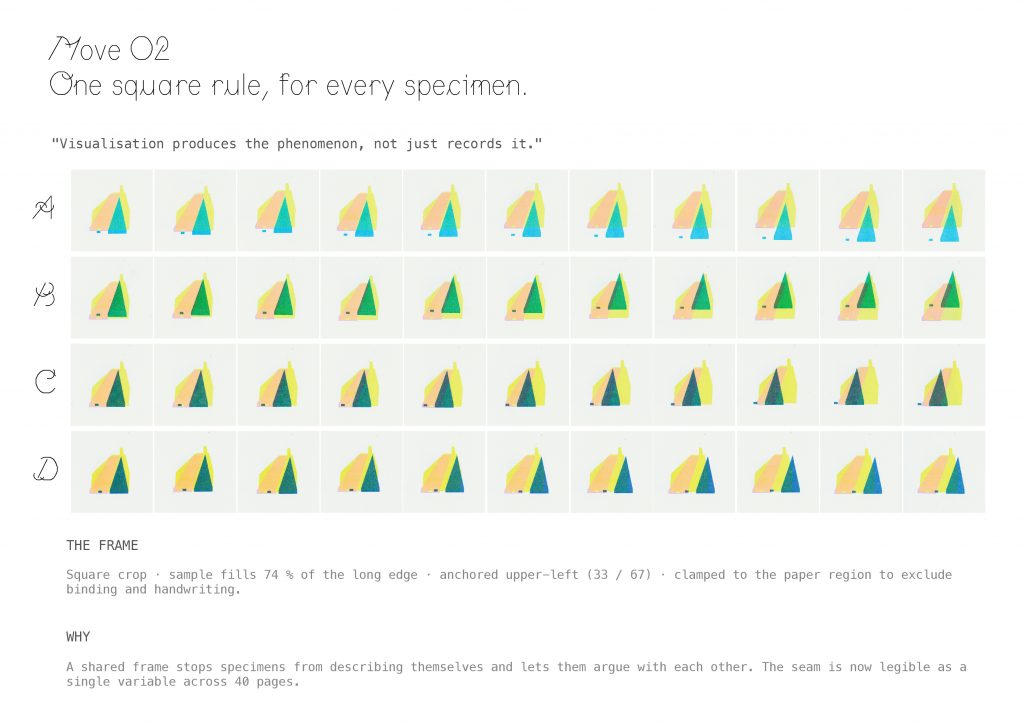
Move Two: one square rule for every specimen.
Drucker’s line was the compass: visualisation produces the phenomenon, not just records it.
The frame — square crop, sample fills 74 % of the long edge, anchored upper-left at 33 / 67, clamped to the paper region to exclude binding and handwriting.
Why — a shared frame stops specimens from describing themselves and lets them argue with each other. The seam is now legible as a single variable across 40 pages.
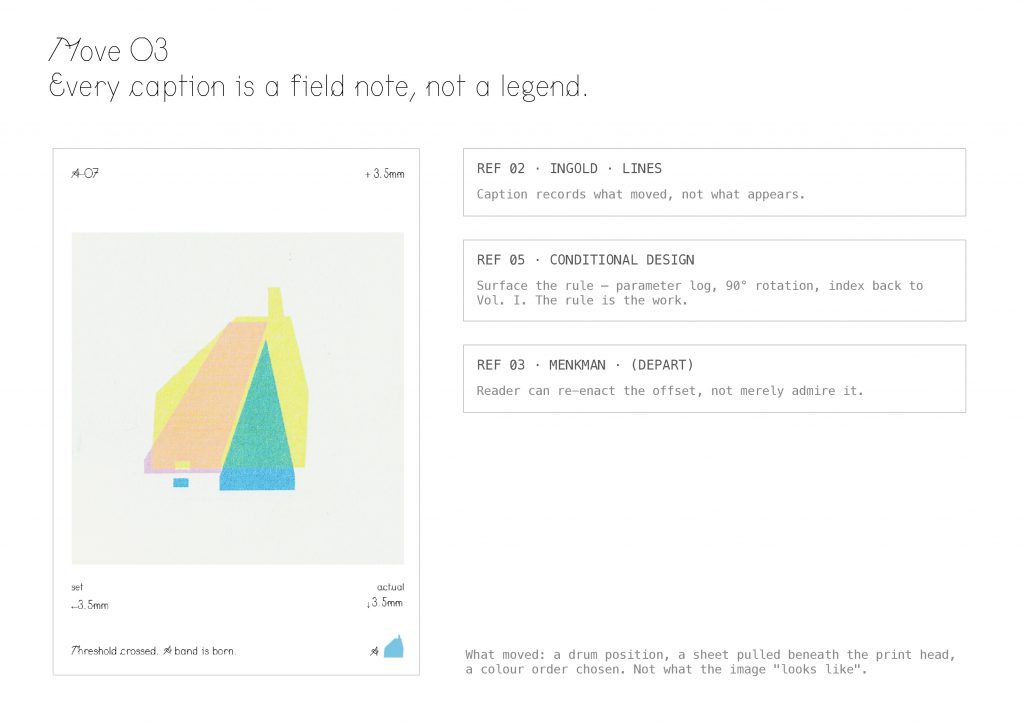
Move Three: every caption is a field note, not a legend.
Following Ingold, the caption records what moved — a drum position, a sheet pulled beneath the print head, a colour order chosen. Not what the image looks like.
Following Conditional Design, I surface the rule itself — parameter log, 90-degree rotation convention, an index back to Volume One. The rule is the work.
And here’s my departure from Menkman: the reader can re-enact the offset, not merely admire it.
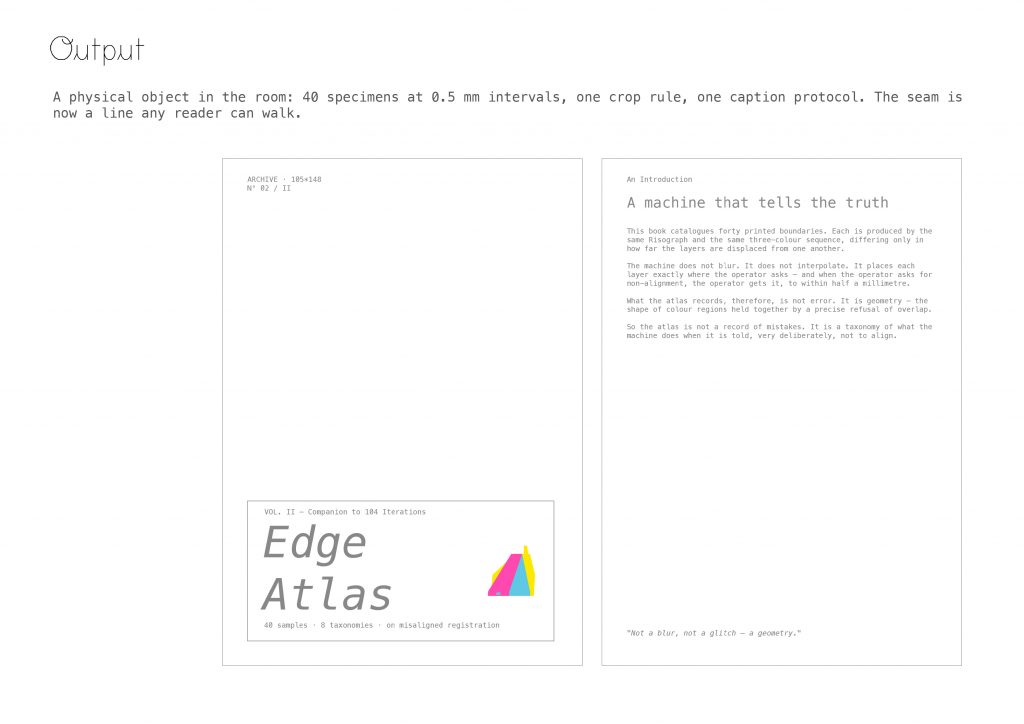
This is the object. Printed and bound this week. Edge Atlas 40 specimens at 0.5-millimetre intervals, one crop rule, one caption protocol. The seam is now a line any reader can walk.
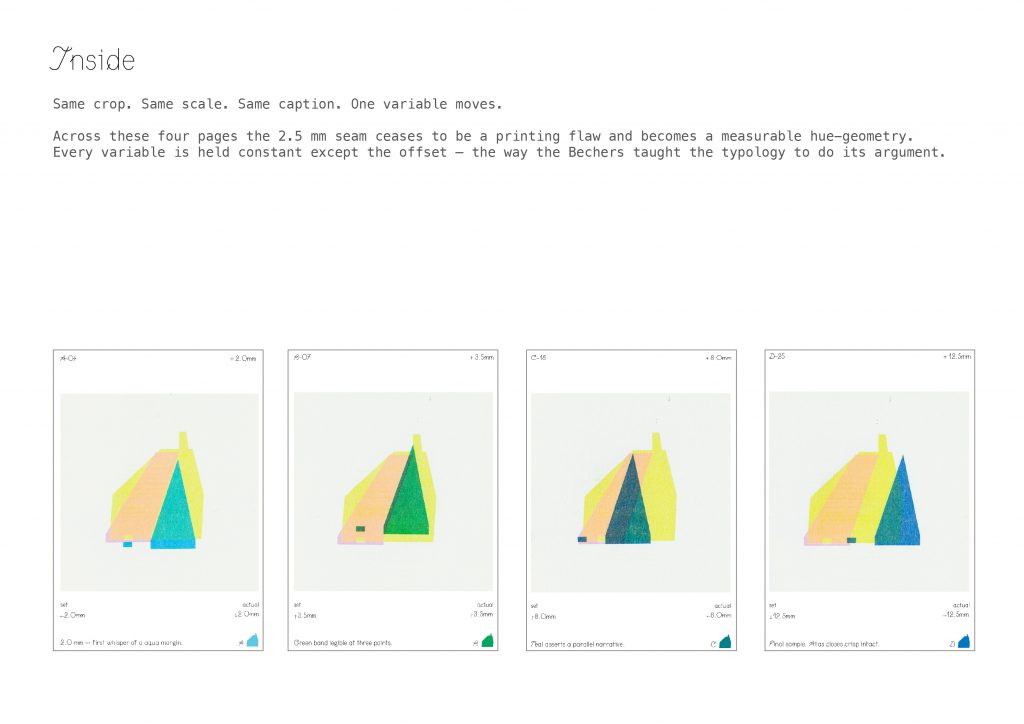
Same crop. Same scale. Same caption. One variable moves. Across these four pages and across all 40 the 2.5-millimetre seam ceases to be a printing flaw and becomes a measurable hue-geometry. Every variable is held constant except the offset. This is the way the Bechers taught typology to do its argument.
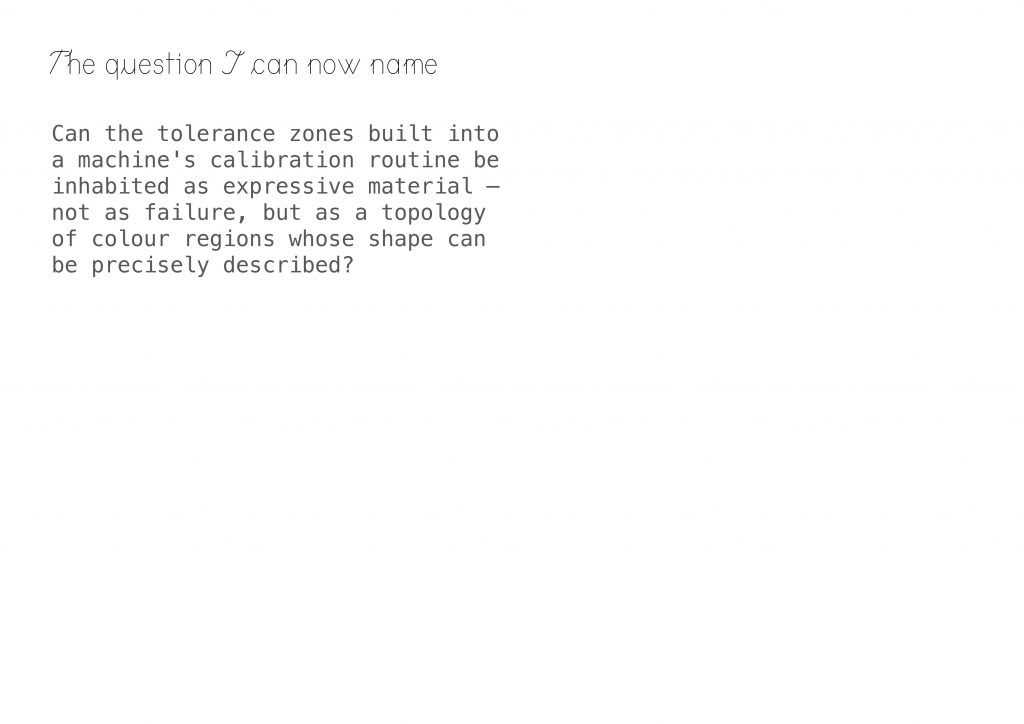
It lets me name the question properly.
Can the tolerance zones built into a machine’s calibration routine be inhabited as expressive material — not as failure, but as a topology of colour regions whose shape can be precisely described?
Line of enquiry
The question I am testing, through making:
I am investigating whether the intentional misalignment of Risograph colour layers can reframe printing “error” as a site of authorial agency rather than a deviation to be corrected. Working within a fixed system — three inks, twenty-six graduated offsets of 0.5 millimetres, a hundred and four printed iterations — I ask whether the tolerance zones built into a machine’s calibration routine can be inhabited as expressive material. Each iteration tests a single variable: a direction, a distance, a colour order. The method is deliberately small and formal. I am not asking what the Risograph means; I am asking what happens at the two-and-a-half-millimetre boundary where the machine’s logic of precision meets an operator’s refusal of it. Crucially, the Risograph does not soften the boundaries it prints: every edge remains crisp, every overlap generates a measurable new hue. What I am cataloguing is therefore not a blur and not a glitch, but a geometry — a topology of colour regions whose shape can be precisely described. Through a companion atlas of forty edge samples, I am moving from making misalignment to classifying its morphologies — treating the printed error as a language with its own grammar, rather than as noise to be eliminated before the real image appears.
Annotated Bibliography
Reference list:
Drucker, J. (2014). Graphesis : visual forms of knowledge production. Cambridge, Massachusetts: Harvard University Press.
Ingold, T. (2016). Lines. Routledge.
Menkman, R. and Geert Lovink (2011). The Glitch moment(um). Amsterdam Institute Of Network Cultures.
Alessandro Ludovico (2018). Post-digital print : the mutation of publishing since 1894. Eindhoven: Onomatopee.
Maurer, L., Edo Paulus, Puckey, J. and Roel Wouters (2013). Conditional design workbook. Amsterdam: Valiz.
Bernd Becher, Hilla Becher and Armin Zweite (2004). Typologies. Cambridge, Mass. London, England Mit Press.
Written Response
Our research initially used carbon emissions data from international student air travel as an indicator of the correlation between individual behavior and carbon emissions. However, as I shifted my focus from carbon emissions themselves to a student travel flowchart, I gradually realized that responsibility is assigned by institutional structures. As an international student, I initially viewed travel as a personal choice. However, after refactoring the administrative processes required for enrollment—CAS confirmation, flight allocation, passport checks, and registration—I discovered that travel was not optional, but institutionally mandated; you had to travel to reach your destination.
This shift reshaped my position as a designer within the context of climate justice and the UAL Net-Zero Emissions Initiative. I no longer viewed carbon emissions as a result of a lifestyle, but rather as a tool to explore how systems generate environmental impacts while constructing a framework for individual responsibility. By redesigning the student enrollment process as an “empowered travel package,” I explored how participation in global education inevitably leads to carbon emissions. We redefined travel as accumulated geological traces, with barcodes becoming central to this research: administratively, they record student information; geologically, they become sediment. This transformation allows us to visualize how recurring institutional processes accumulate into traces on Earth, rather than isolated actions.
This project deepened my understanding of the necessity for structural reflection on climate justice within institutions. Therefore, design should be a method to reveal systemic problems, rather than a method to exacerbate individual responsibility.
Bibliography:
Vishmidt, M., Grojs, B., Metahaven (Design Studio and Van, J. (2010). Uncorporate identity. Baden: Lars Müller ; Maastricht.
Van der Velden and Kroek’s concept of “Uncorporate identity” has profoundly influenced our understanding of how organizations construct abstract concepts through visual systems. This theory posits that organizations cannot be fully seen; they require symbols, signs, and brands to represent their intangible structures. This idea directly prompted a shift from examining the carbon emissions of individual behavior to scrutinizing how institutions create fluidity while concealing their structural roles.
Metahaven’s analysis of how nations and corporations use identity systems during crises helped us re-examine documents like school admissions papers and airline tickets, moving beyond viewing them as neutral administrative documents to see them as tools of empowerment and abstraction. Like corporate identity filling institutional gaps, these documents personalize responsibility while masking systemic dependencies.
Their speculative and analytical approach also validates the effectiveness of refactoring administrative procedures as a design strategy. We are not designing solutions, but revealing the mechanisms of responsibility allocation. This perspective deepens our stance that design is not merely a communication system—it actively shapes how accountability is presented.
Latour, B. (2017). Visualisation and Cognition: Thinking with Eyes and Hands | bruno-latour.fr. [online] Bruno-latour.fr. Available at: http://www.bruno-latour.fr/node/293 [Accessed 26 Feb. 2026].
Bruno Latour’s Facing Gaia challenges the modernist binary of society and nature, reconstructing the relationship between humanity, institutions, and the planet. In our project, this book helped us shift our understanding of carbon emissions from individual behavior to the systemic conditions that generate them. Latour insists that the planet must be viewed as an active participant (“Gaia”) within a political and epistemological framework, a concept that resonates with our analogy of geological sediments as stacks of bills.
Latour’s emphasis on how institutions and bureaucratic structures regulate human activity and its material consequences provides the theoretical basis for our decision to integrate carbon emissions into administrative documents rather than isolated visual charts. His critique of representation—that visual and textual systems are not neutral but actively shape perception—led us to explore how institutional documents such as CAS letters and bills allocate responsibility. This perspective validates our approach of redefining authorized travel as a venue for responsibility allocation, rather than placing responsibility within individual behavior. Thus, Latour’s research reinforces our view that climate justice involves revealing structural conditions, rather than making moral judgments about individual choices.
Easterling, K. (2014). Extrastatecraft. Verso Books.
Keller Easterling’s Extrastatecraft is crucial to understanding how power operates through infrastructure rather than overt political declarations. Easterling argues that the contemporary global system functions through “infrastructure spaces”—spaces containing repeatable formulas, standards, and administrative agreements that subtly organize the movement of people, trade, and governance. This perspective directly influences our shift from viewing emissions as individual acts to examining the procedural structures of empowered flows.
In our project, CAS letters, tickets, and passports are not viewed as symbolic items, but as infrastructure tools. They act as spatial software, authorizing, validating, and facilitating cross-border flows. Easterling’s analysis helps us recognize that these repeatable administrative forms produce material consequences—including carbon emissions—that are not overtly political.
Her concept of “infrastructure as operating system” validates our methodology of reconstructing empowered flows as a series of agreements, rather than individual flight events. This paper redefines student travel as participation in infrastructure systems, rather than individual lifestyle choices, reinforcing our argument that climate justice requires examining the institutional frameworks that subtly generate environmental impacts.
Malm, A. (2016). Fossil Capital. Verso Books.
Andreas Malm’s Fossil Capital reframes climate change as the result of structural economic decisions rather than collective human behaviour. By tracing the historical shift to steam power in nineteenth-century Britain, Malm argues that fossil fuel dependency was not an inevitable technological evolution but a strategic choice made within capitalist systems to maximise control and profit. This distinction between systemic compulsion and individual agency strongly influenced our project’s conceptual shift.
Initially, we approached student mobility as aggregated personal emissions. Malm’s analysis helped us recognise that large-scale carbon production is embedded in institutional and economic structures long before it appears as individual behaviour. In the context of global higher education, mobility is not simply a lifestyle decision but a structural condition tied to access, competition, and institutional expansion.
Rather than positioning students as primary agents of responsibility, Malm’s work encouraged us to interrogate how systems generate carbon-intensive infrastructures that individuals must navigate. This perspective strengthened our argument that climate justice requires examining the historical and institutional foundations of mobility, rather than reducing emissions to matters of personal morality.
Levenson, J. (2021). Templo teams up with the United Nations to give its latest climate research a cohesive visual identity. [online] www.itsnicethat.com. Available at: https://www.itsnicethat.com/articles/templo-united-nations-graphic-design-031121.
Templo’s redesign of the United Nations Charter offered a pivotal reference for our project by demonstrating how graphic design can actively interrogate and reframe institutional language rather than merely beautify it. The original Charter is an authoritative legal text—opaque, dense, and associated with global governance—but Templo recasts its structure into three distinct visual grammars that make its underlying protocols, hierarchies, and rhetorical constructions legible. This resonated strongly with our enquiry into how administrative artefacts, such as CAS letters, tickets, and passport records, function not simply as data carriers but as systems that authorise, verify, and normalise states of mobility.
The project influenced both our methodological approach and our conceptual positioning: instead of designing a “carbon visualisation” that would fixate on individual emissions, we began to treat bureaucratic formats themselves as the site of critical design intervention. Templo’s work challenged us to consider how institutional documents are effectively visual infrastructures. Their project validated our decision to adopt speculative administrative design as our strategy, highlighting how the very grammar of official documentation can shape where accountability is perceived, allocated, and experienced.
Tapper, T. (2022). Creativity isn’t carbon neutral: How complicit are agencies in the climate crisis? [online] www.itsnicethat.com. Available at: https://www.itsnicethat.com/articles/nice-and-serious-creativity-isnt-carbon-neutral-opinion-creative-industry-081122.
Jens Andersen’s opinion piece highlights an important but often overlooked consideration: creative industries are not inherently carbon neutral simply by virtue of communication or aesthetics. Instead, as Andersen argues, the practices, systems, and infrastructures that support creative work itself incur material and energy costs that must be acknowledged rather than obscured. This resonated with our project’s methodological shift away from designing carbon visualisations as neutral representations toward interrogating how visual forms and systems embody and distribute responsibility.
The article encouraged us to reflect on the environmental implications not just of final outputs (e.g., posters, reports, interfaces) but of the underlying procedural and infrastructural conditions that make those outputs possible. In our enquiry, this helped reinforce the idea that design cannot be disentangled from the systems that sustain it; rather than depicting individual emissions as behavioural results, we position design as a tool for making visible the administrative mechanisms that generate and record emissions. Andersen’s critique challenged us to avoid treating data visualisation as an eco-friendly “solution” and instead situate our work within a broader acknowledgement of the creative process’s entanglement with environmental impact. This has influenced how we articulate our environmental stance and frame the project’s critical intervention.